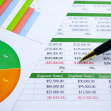
An Executive Dashboard in Excel is a dynamic and visually compelling tool designed to provide a high-level overview of an organization’s key performance metrics and resource utilization. This template consolidates complex data into intuitive visualizations, such as charts, graphs, and key performance indicators (KPIs), offering executives a clear, concise snapshot of the organization’s overall performance.
The dashboard focuses on the highest-priority resources and their performance, allowing leaders to:
- Monitor Success Metrics: Track organizational goals and measure progress in real-time.
- Identify Trends: Analyze trends and patterns across departments or projects to inform strategic decisions.
- Optimize Resource Allocation: Understand resource performance to enhance productivity and efficiency.
- Improve Functionality: Pinpoint areas requiring attention for streamlined operations and improved outcomes.
Key Features of the Executive Dashboard:
- Comprehensive Data Integration: Combines data from multiple sources for a unified view.
- Customizable Visualizations: Tailored KPIs and charts to align with organizational goals.
- Interactive Elements: Filters, slicers, and drill-down capabilities for deeper insights.
- Real-Time Updates: Automated data refreshes for up-to-date performance tracking.
- User-Friendly Design: Clean layout emphasizing clarity and ease of use.
This dashboard serves as a strategic decision-making tool, enabling executives to make informed, data-driven decisions that align with the organization's objectives. It is essential for fostering transparency, accountability, and agility in today’s fast-paced business environment.
CCO Public domain – No rights reserved; users can copy, modify, distribute, and use for any purpose without restriction.


